Chapter 5 Profiling: “The most important thing”
Profvis is a tool for helping you to understand how R spends its time. It provides a interactive graphical interface for visualizing data from Rprof, R’s built-in tool for collecting profiling data.
To install profvis from CRAN: install.packages("profvis")
The RStudio IDE includes integrated support for profiling with profvis. These features are available in the current Preview Release of RStudio.
Profvis: Profiling tools for faster R code
- How do I make my R code faster?
- Why is my R code slow?
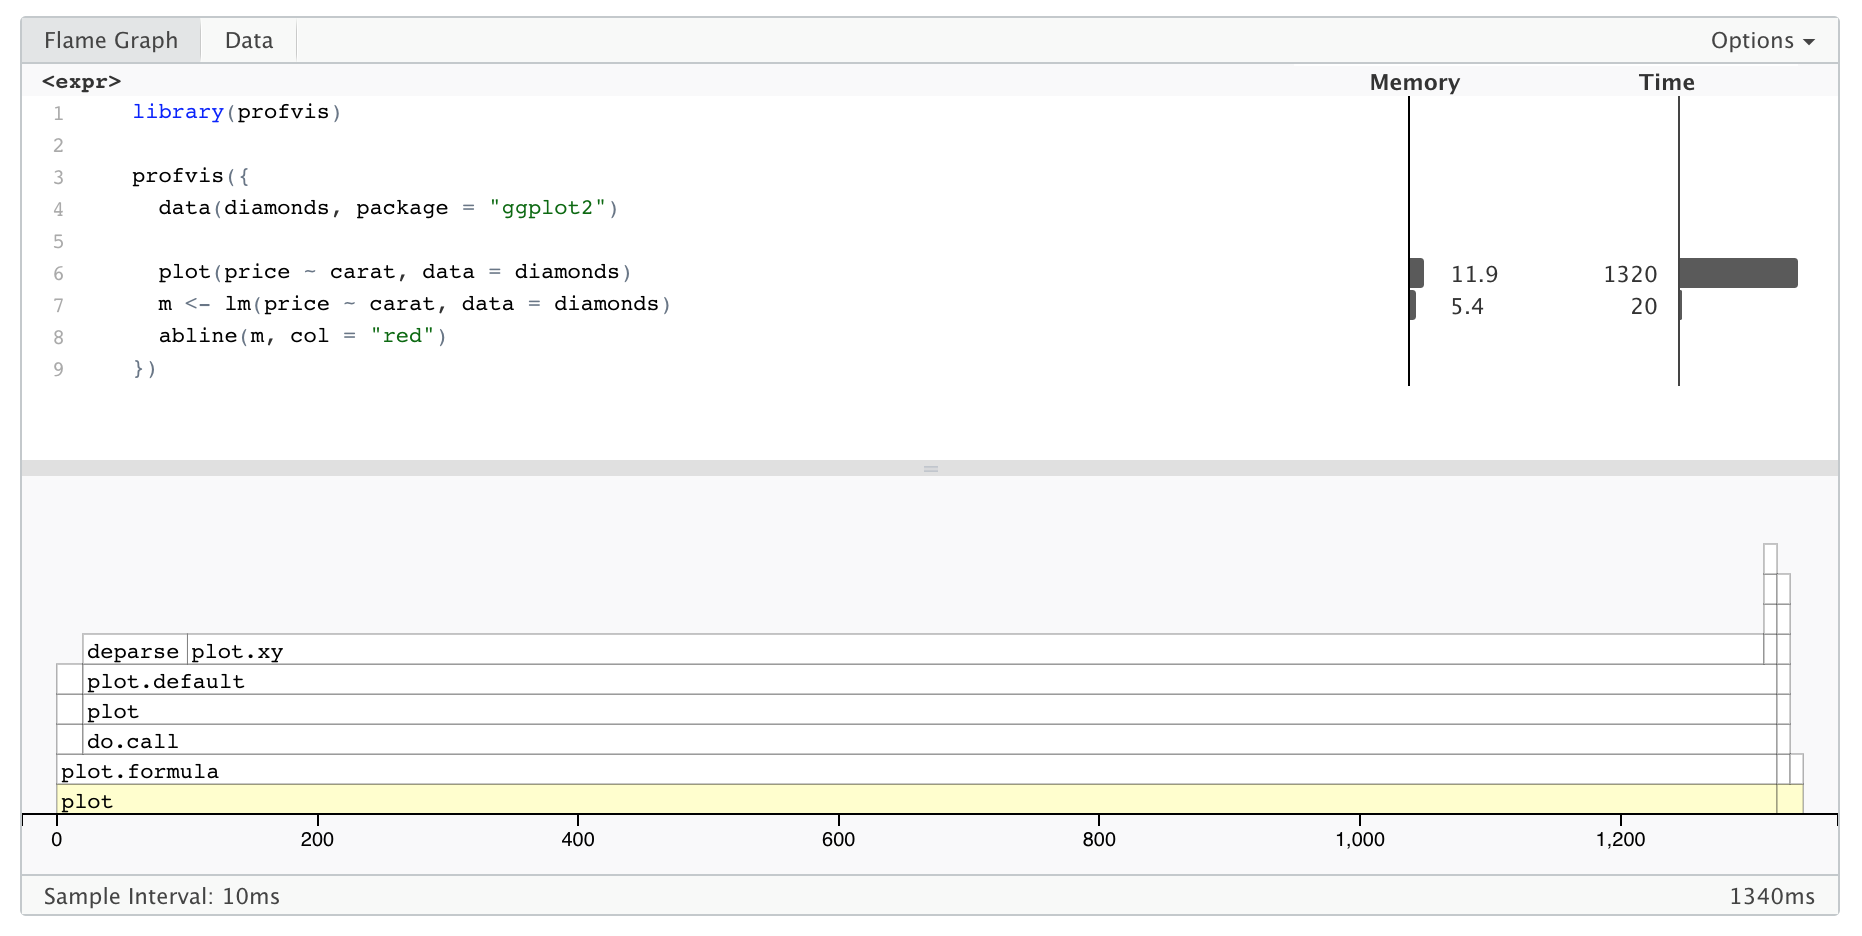
Profvis in Use
Each block in the flame graph represents a call to a function, or possibly multiple calls to the same function. The width of the block is proportional to the amount of time spent in that function. When a function calls another function, another block is added on top of it in the flame graph.
The profiling data has some limitations: some internal R functions don’t show up in the flame graph, and it offers no insight into code that’s implemented in languages other than R (e.g. C, C++, or Fortran).
Profvis is interactive. You can try the following:
- As you mouse over the flame graph, information about each block will show in the info box.
- Yellow flame graph blocks have corresponding lines of code on the left. (White blocks represent code where profvis doesn’t have the source code – for example, in base R and in R packages. But see this FAQ if you want package code to show up in the code panel.) If you mouse over a yellow block, the corresponding line of code will be highlighted. Note that the highlighted line of code is where the yellow function is called from, not the content of that function.
- If you mouse over a line of code, all flame graph blocks that were called from that line will be highlighted.
- Click on a block or line of code to lock the current highlighting. Click on the background, or again on that same item to unlock the highlighting. Click on another item to lock on that item.
- Use the mouse scroll wheel or trackpad’s scroll gesture to zoom in or out in the x direction.
- Click and drag on the flame graph to pan up, down, left, right.
- Double-click on the background to zoom the x axis to its original extent.
- Double-click on a flamegraph block to zoom the x axis the width of that block.
Things to remember:
- Understand how the sampling profiler works
- Understand the
profvisinterface - Sometimes performance bottlenecks are counterintuitive!
5.1 Activity: Profiling
First: Create a profile of our app
Discussion:
Understanding app performance
- Where does our app spend most of its time?
- Do any parts of the profile surprise you?
- If you test the app again, do you get the same results?
Additional Group Discussion
- Is the call to
gtslow? - Why does
getStudentNumtake so much longer thangetStudentBin? How could we speed this up?
Deliverable: Optimization Recommendations
- One recommendation for how we could speed up our app.
References and Resources: